


I am a table girl. I use them all of the time to create graphic organizers for my class. I like how they provide a framework and direction for the students. After students add information to a graphic organizer, the ideas are sorted and grouped in a way that help students develop generalizations for our units of study, review key concepts, and visualize a big picture.
I use MS Word (I know-- I am in the minority) to build all of my graphic organizers. Since many schools use Word as the primary way to publish documents in the classroom, I thought it might be worth sharing some of my formatting strategies. These are good technology tips for both teachers and students.

The best tip I can give people using MS Word is to turn the formatting button on. This shows all of the background strokes you use while creating a document. None of the background symbols appear when printing, but it allows you to see where you have pressed buttons and what types of spacing you have. If your students have all kinds of funky formatting happening in their school documents, turn the formatting button ON to see all of the times they pressed ENTER!

Next, insert a basic table with the needed numbers of rows and columns. Don't worry if you want to add or delete rows and columns later; it is easy to do. Once you have a basic table in the Word document, you are ready to customize. Most of the functions you will use will be accessed under the LAYOUT tab. This tab is only visible when you have clicked your cursor inside a cell (one of the boxes) on the table.
1. Making the Table Larger
- To make the table cells (boxes) larger, hover the cursor over the bottom line. When it changes to two parallel lines with an up and down arrow, left click, hold, and drag down.
- To move any of the gridlines within the table, hover over the lines you would like to move, wait for the parallel icon with up down arrows to appear, left click, hold, and drag.

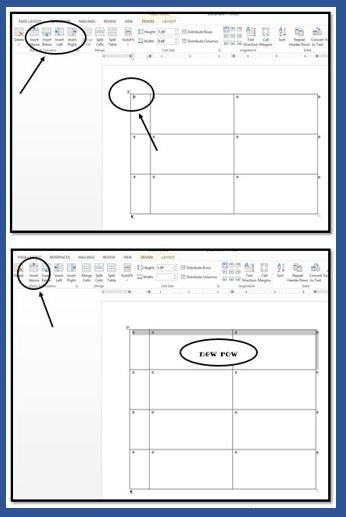
2. Making the Rows and Columns Equal Sizes
- To distribute rows evenly, highlight all of the rows you would like to be the same height. Select distribute rows in the LAYOUT tab. To distribute columns evenly, highlight all of the columns you would like to be the same width. Select distribute columns. This is where the formatting function comes in handy. There will be a small circle inside each cell. You can see if you have grabbed the cells you need by making sure the little circles in the appropriate boxes are highlighted.

3. Adding Rows and Columns
- To insert additional rows or columns, click your cursor in the cell next to where you want to add the row or column. Choose insert above, below, right, or left depending on what you need.
4. Adding and Formatting Text
- To add text, click in the cell where you need the text. Type your words (I like to add all words first then work on the formatting).
- To change the font, make the size, bigger, center, etc. use the buttons in the HOME tab you use when formatting regular documents.
- To change the text direction, highlight the text you want to flip and click the text direction button. Click multiple times until the text is turned the direction you need.

- To align the text within the cell, click the text symbols that show different line spacing within a box right next to the text direction button.

Spend some time clicking around in the LAYOUT tab of your document. You can merge and split cells, turn gridlines on and off, and add background colors to each cell, row, or column. You can also click outside of your table and insert clipart pictures. Right click on the picture and choose wrap text/in front of text. After that, you can drag your picture anywhere on your page.
For a printable version of these table tips with step by step instructions and screen shots, visit Creating a Graphic Organizer to download. I also have free printable directions for formatting MS Word essay documents available for free at my TeachersPayTeachers store.
Happy Creating!
Caitlin
TheRoomMom

